Do you know which pieces of content are performing the best on your website? It could be the one you least expect. On the other hand, the blog post that you thought was going to be a hit isn't getting the traffic you predicted.
So how do you find out this crucial information? Google Analytics is a great tool that can help you understand how your website visitors engage with your website content. It's provides valuable reports and, plus, it's free!
Keeping track of your content's performance is not only relevant to your current published pieces, but it can also help you establish a better plan for your future content. In this post, we'll cover how to use Google Analytics to find your top-performing content.
Want to actually understand Google Analytics? Well, you can learn all the basics in just 9 days!
Sign up below to have a short video texted to you every day to learn more about Google Analytics:
How Finding Your Top Content Is Relevant to Your Future Strategy
Creating a content marketing strategy is important, but you truly can't gauge what type of content you need to produce without reviewing how your current content is performing. With this strategic approach, you will be identifying gaps and opportunities for your content strategy. You may also uncover several top-performing pieces of content that can be easily tweaked or modified to be new content, so that you don't have to start from scratch.
Read our blog post on auditing your content to learn more about the importance of this process.
How to Use Google Analytics to Find Your Top Website Content
Now that you know why it's essential to know this information, here's how you can use Google Analytics to find this content.
Set Up the Right Goals
Your data from Google Analytics will be even more valuable once you create Goals for your website. This means that you can define what counts as a true conversion on your website. There are 4 types of goals you can set: Destination, Duration, Pages/Screens per Session, and Event. When a user hits one of your Goals, it will be registered as a conversion, and you can keep track and learn more about these conversions in different reports in Google Analytics.
Need help setting up Goals? Here are instructions from Google Analytics help site.
Access All Pages Report
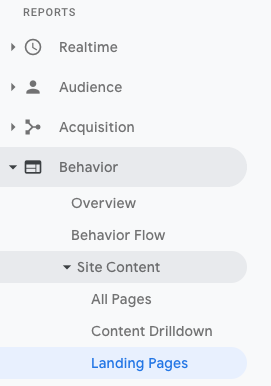
Under Reports on the left sidebar click Behavior, then click Site Content, and then click All Pages.
 Be sure to change the date range in the upper right-hand corner to analyze at least a quarter's worth of website traffic. You may want to review how your pages perform over the course of a year to see if there are any seasonal patterns.
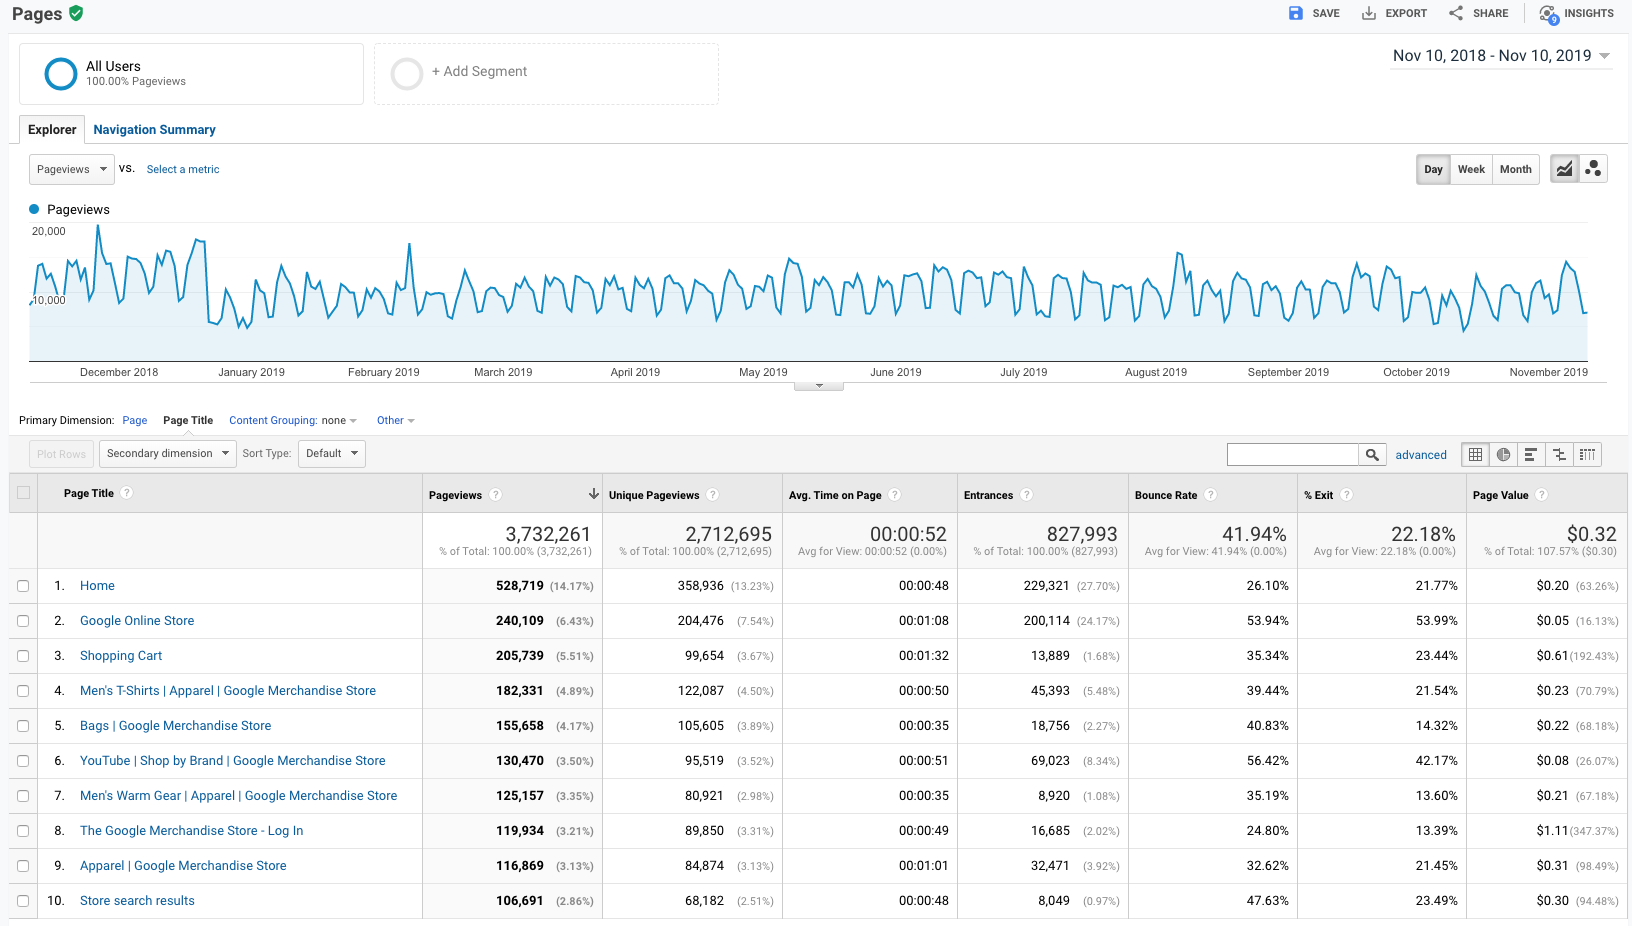
 The All Pages report will show you the pages on your website that receive the most traffic. It shows the following metrics:
- Pageviews
- Unique Pageviews
- Average Time on Page
- Entrances
- Bounce Rate
- Percentage of Exits
- Page Value

Using this data, you can see which of your website pages are visited the most frequently. Questions to ask about these top-performers are, "What am I doing right on these pages?" and "What can I do better?". To plan out your future content, assess which topics and formats of your existing content perform the best on your website. This way, you'll know you're heading in the right direction for your new content.
Access Landing Page Report
Under Reports on the left sidebar click Behavior, then click Site Content, and then click All Pages.

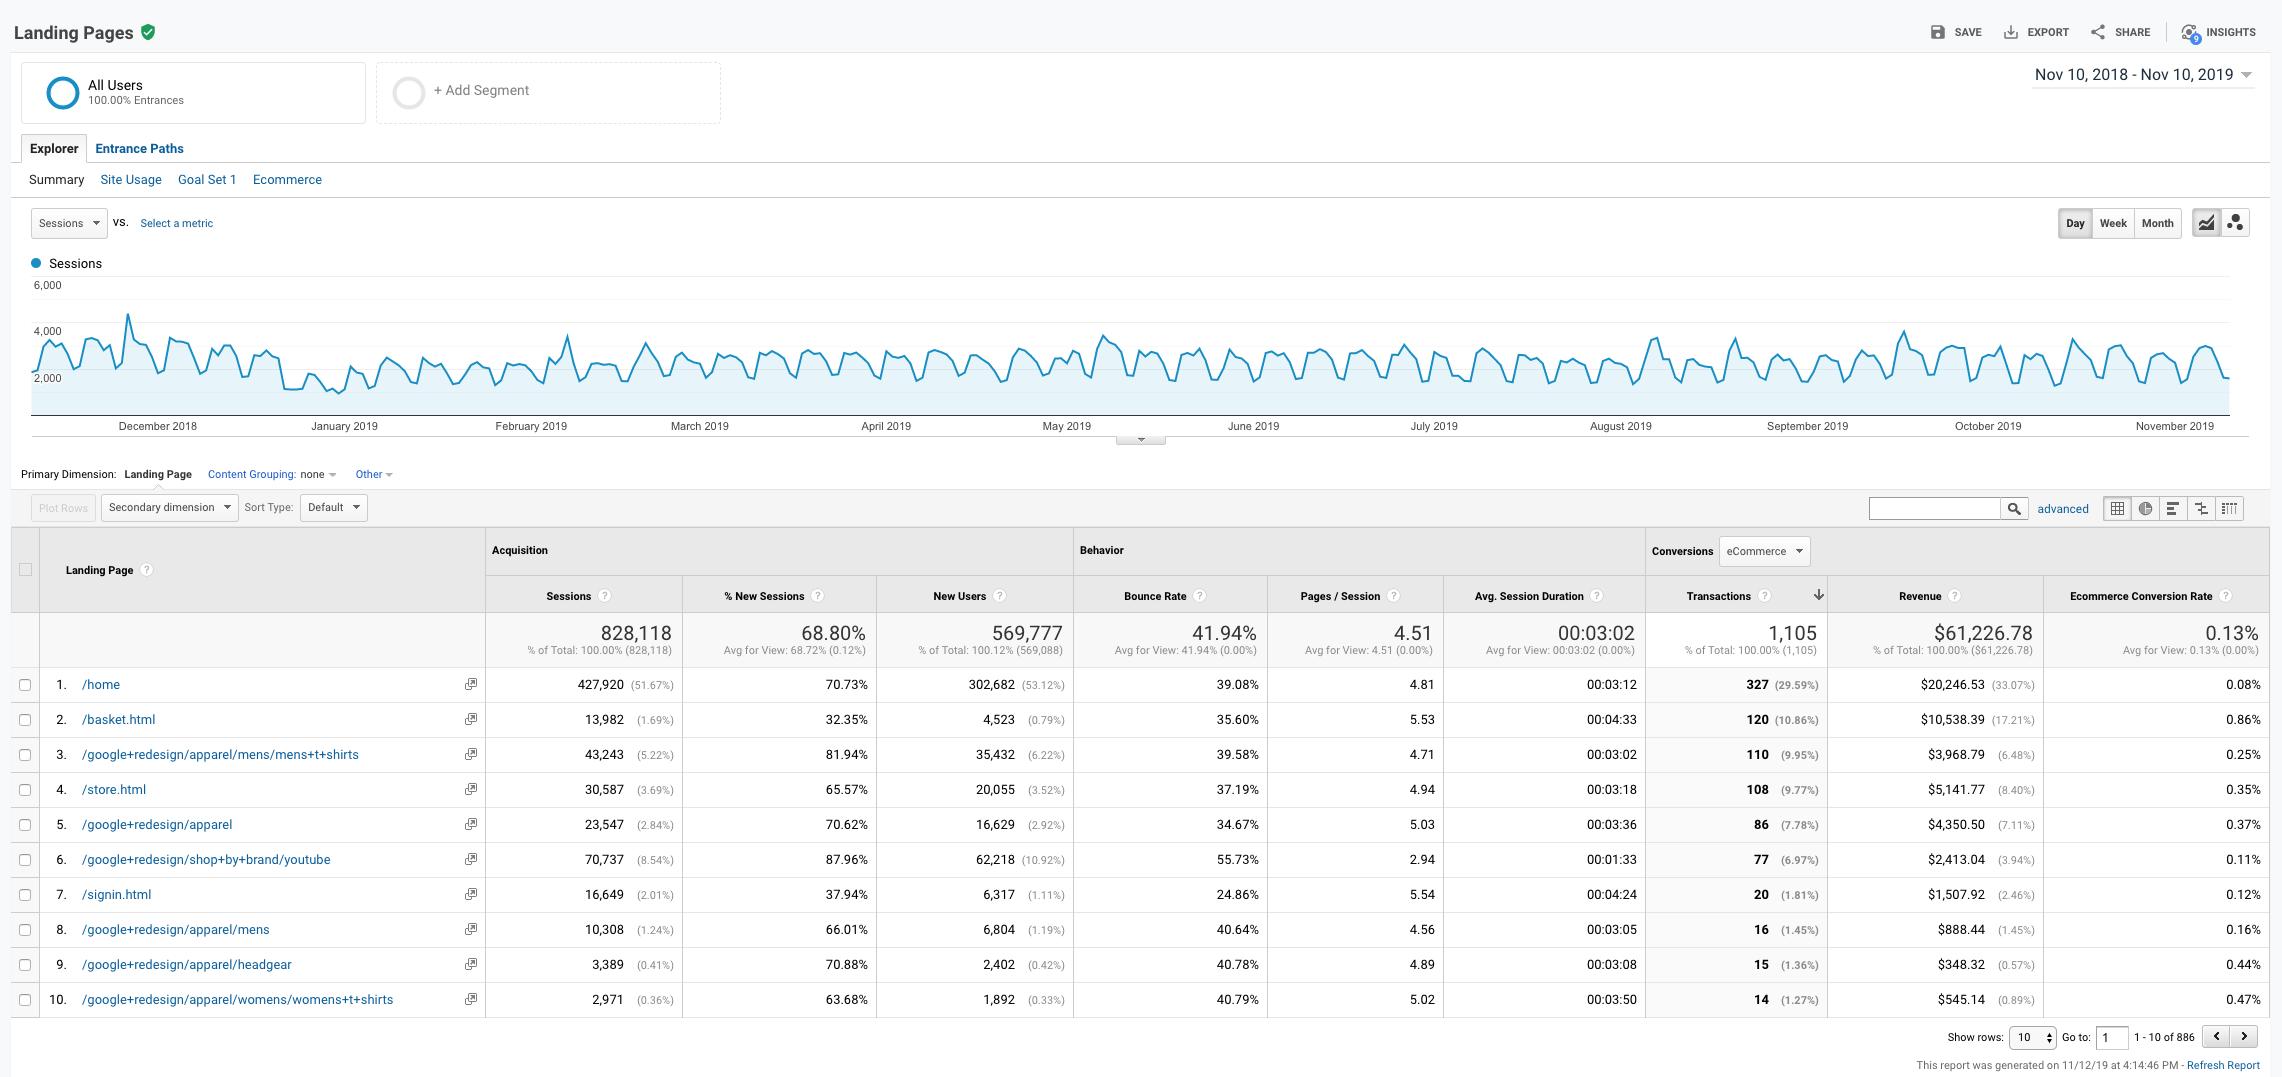
In Google Analytics, the term "landing page" refers to the first page that users see when they arrive to your website from any traffic source. Why does this matter? First, you'll know which one of your website pages is giving your users the first impression of your brand. You'll want to ensure that your top landing pages provide your users with the information they need so that they continue to engage with your content.
Secondly, if you have Goals set up correctly in Google Analytics, you can see which pages are great at ultimately driving conversions. This information is valuable when it comes to optimizing pages that can be performing better to convert your users.
The Landing Page report shows you the following metrics:
- Sessions
- Percentage of New Sessions
- New Users
- Bounce Rate
- Pages Viewed per Session
- Average Session Duration
With Goals set up, you can monitor the following metrics:
- Goal Conversion Rate
- Goal Completions
- Goal Value
With Ecommerce enabled, you'll be able to see the following metrics:
- Transactions
- Revenue
- Ecommerce Conversion Rate

What to Do After You Find Your Top Content
Discovering your top content isn’t just to see if you hit your goals or not, it’s to help you optimize your current content and plan for the future. Without this data, you wouldn’t be able to pinpoint any areas for improvement. These two reports will help get you started in discovering your top content.

